KING50 Copilot: auditing a decision panel that was lying with a number.
A Chrome side panel that turns live market data into one explainable read for a manual trader. The first version worked, but it showed a 100/100 confidence score on evidence that added up to 61. This is the audit that found it, the hierarchy redesign that followed, and how the panel was rebuilt around the question the user actually asks.
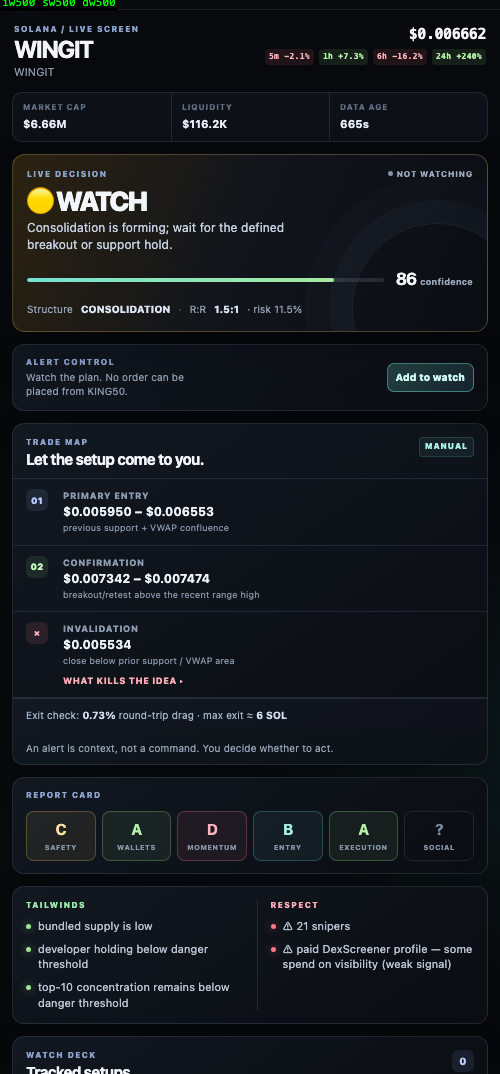
One question, under time pressure: should I act on this?
The user is a manual trader looking at a token with a few seconds of attention to spare. They open the panel to get one read: watch, enter, or walk away, and why. The panel is explicitly a co-pilot. It cannot place orders. Its whole value is that the user trusts the read enough to act on it, so anything that erodes trust is a product failure even if the code is correct.
Three findings, one of them serious.
The panel showed 100/100 confidence while the visible factors summed to 61. Tracing the data path: a hidden +50 baseline was added before a clamp to 100. Any moderately positive setup pinned at the ceiling. The number was not a lie in code, but it was a lie on screen.
A "LOW bundler risk" classification was being emitted through the risk channel, so a positive signal rendered as a warning. The user read reassurance as a red flag.
The verdict appeared twice in the header. Traced to deliberate backward compatibility for an older client. Documented and left in place rather than "fixed" into a regression.
Score normalized against the real maximum instead of clamped after a hidden baseline, with baseline, factor sum, raw, and max exposed in the payload so the number can always be audited. The LOW classification moved to the positives channel.
Reorder the panel around the decision, not the data.
The original layout led with market stats and made the user assemble a verdict from pieces. The redesign inverts it. The sequence now matches how a person actually decides:
Current price plus 5m / 1h / 6h / 24h change chips replace the duplicate verdict chip in the header.
WATCH / ENTER / AVOID in large type with a one-sentence reason, the honest confidence number, and structure, risk-reward, and risk percentage on one line.
Primary entry, confirmation, and invalidation as three numbered zones with the price levels and the reason for each. "What kills the idea" is a first-class element, not a footnote.
Round-trip cost and maximum exit size shown before the user commits, because a setup you can't exit is not a setup.
A–D grades across safety, wallets, momentum, entry, execution, and social, followed by the tailwinds and risks that produced them. The Essential view shows real factors; a Pro view adds the ledger reconciliation.
How the audit was run.
- Trace the number to its source. Every displayed figure was followed back through the scoring code until the displayed value and the computed value could be reconciled by hand.
- Test harness. A stub of the extension API plus saved real payloads so every layout change could be rendered and checked against a known input without a live market.
- Two views, one data model. Essential and Pro views draw from the same payload so the simpler view never shows something the detailed view contradicts.
- Ticking data age. The panel shows how old its data is, so a stale read is visibly stale instead of silently wrong.